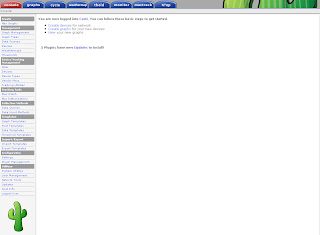
Start in the Console by clicking Data Templates in the Templates section. Click Add in the top right corner and enter the values from the following screenshot. Then click Save.

Afterwards create two more Data Templates based on the next two screenshots.
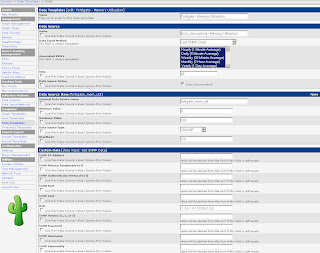
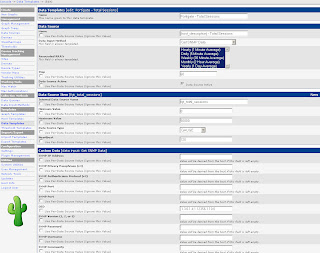
The Data Templates tell Cacti which values (OIDs) to monitor.
Next, go to Graph Templates in the Templates section. As before click Add in the top right corner and define the following two Graph Templates: Fortigate – System Resources and Fortigate – Total Sessions. The System Resources graph will monitor CPU and memory utilization in one combined graph.


I needed to thank you for this fantastic read!! I absolutely enjoyed
ReplyDeleteevery little bit of it. I've got you saved as a favorite to check out new stuff you post…
my website - Visual Impact Muscle Building Review
Thanks and I have a tremendous offer: How Much Are House Renovations Stardew Valley split level home renovation
ReplyDelete